Introductory-level course teaches students the basic concepts of statistics and the logic of statistical reasoning. Designed for students with no prior knowledge in statistics, its only prerequisite is basic algebra. Includes a classical treatment of probability.
Probability & Statistics
$25
- Description
- What students will learn
- Learning objectives by module
- Course assessments, activities, and outline
- System requirements
- Other course details
- Included instructor tools
Description
Probability & Statistics introduces students to the basic concepts and logic of statistical reasoning and gives the students introductory-level practical ability to choose, generate, and properly interpret appropriate descriptive and inferential methods. In addition, the course helps students gain an appreciation for the diverse applications of statistics and its relevance to their lives and fields of study. The course does not assume any prior knowledge in statistics and its only prerequisite is basic algebra.
We offer two versions of statistics, each with a different emphasis: Probability and Statistics and Statistical Reasoning. Each of the courses includes all expository text, simulations, case studies, scored comprehension tests, interactive learning exercises, and the StatTutor labs. Both Probability & Statistics and Statistical Reasoning contain all of the instructions for the five statistics packages options we support. To do the activities, students will need their own copy of Microsoft Excel, Minitab, the open source R software, TI calculator, or StatCrunch.
One of the main differences between the courses is the path through probability. Probability and Statistics includes the classical treatment of probability as it is in the earlier versions of the OLI Statistics course, while Statistical Reasoning gives a more abbreviated treatment of probability, using it primarily to set up the inference unit that follows it.
Throughout the course there are many interactive elements. These include: simulations, “walk-throughs” that integrate voice and graphics to explain an example of a procedure or a difficult concept, and, most prominently, computer tutors in which students practice problem solving, with hints and immediate and targeted feedback. The most elaborate of such activities is the “StatTutor,” a tool that supports students as they go through the processes of data analysis while emphasizing the big picture of statistics.
The course is built around a series of carefully devised learning objectives that are independently assessed. Most of the interactive tutors are tagged by learning objective and skill, and so student work can be tracked by the system and reported to the instructor via the Learning Dashboard. These give the instructor insight into mastery of learning objectives and skills, both for the class as a whole and for individual students. This full-semester course originally was designed to be used as a stand alone (with no instructional support by a teacher), however studies have shown that it is best and most effectively used in the hybrid mode together with face to face instruction.
In-Depth Description
Topics Covered:
Exploratory Data Analysis, Producing Data, Probability, and Inference.
Both Probability and Statistics and Statistical Reasoning include four units, with different Probability units (Unit 3), as outlined below.
Unit 1
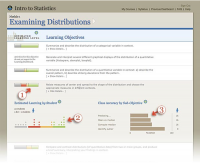
Exploratory Data Analysis. This is organized into two modules – Examining Distributions and Examining Relationships. The general approach is to provide students with a framework that will help them choose the appropriate descriptive methods in various data analysis situations.
Unit 2
Producing Data. This unit is organized into two modules – Sampling and Study Design.
Unit 3
Probability. As stated above, this is the unit where the two versions of the course differ. In the Probability and Statistics course the unit is a classical treatment of probability and includes basic probability principles, conditional probability, discrete random variables (including the Binomial distribution) and continuous random variables (with emphasis on the normal distribution). The probability unit of the Statistical Reasoning version of the course essentially acts as a “bridge” to the inference section and includes only those concepts necessary to support a conceptual understanding of the role of probability as the “machinery” behind inference. Both probability units culminate in a discussion of sampling distributions that is grounded in simulation.
Unit 4
Inference. This unit introduces students to the logic as well as the technical side of the main forms of inference: point estimation, interval estimation and hypothesis testing. The unit covers inferential methods for the population mean and population proportion, Inferential methods for comparing the means of two groups and of more than two groups (ANOVA), the Chi-Square test for independence and linear regression. The unit reinforces the framework that the students were introduced to in the Exploratory Data Analysis for choosing the appropriate, in this case, inferential method in various data analysis scenarios.
The course was designed to be used as a stand alone (with no instruction in the background) however studies have shown that it is best and most effectively used in the hybrid mode together with face to face instruction.
What students will learn
By the end of this course, students will have gained an appreciation for the diverse applications of statistics and its relevance to their lives and fields of study. They will learn to:
- develop strong learning strategies for Probability & Statistics, as well as other online courses.
- identify sampling methods used to produce data.
- create and analyze distributions of variables.
- apply the rules of probability to determine the likelihood of an event.
- use a sample to infer (or draw conclusions) about the population from which it was drawn.
Learning objectives by module
Unit 2: Exploratory Data Analysis
- Module 4: Examining Distributions
- Apply the standard deviation rule to the special case of distributions having the “normal” shape.
- Compare and contrast distributions (of quantitative data) from two or more groups, and produce a brief summary, interpreting your findings in context.
- Generate and interpret several different graphical displays of the distribution of a quantitative variable (histogram, stemplot, boxplot).
- Relate measures of center and spread to the shape of the distribution, and choose the appropriate measures in different contexts.
- Summarize and describe the distribution of a categorical variable in context.
- Summarize and describe the distribution of a quantitative variable in context: a) describe the overall pattern, b) describe striking deviations from the pattern.
- Module 5: Examining Relationships
- Classify a data analysis situation (involving two variables) according to the “role-type classification,” and state the appropriate display and/or numerical measures that should be used in order to summarize the data.
- Compare and contrast distributions (of quantitative data) from two or more groups, and produce a brief summary, interpreting your findings in context.
- Graphically display the relationship between two quantitative variables and describe: a) the overall pattern, and b) striking deviations from the pattern.
- In the special case of linear relationship, use the least squares regression line as a summary of the overall pattern, and use it to make predictions.
- Interpret the value of the correlation coefficient, and be aware of its limitations as a numerical measure of the association between two quantitative variables.
- Produce a two-way table, and interpret the information stored in it about the association between two categorical variables by comparing conditional percentages.
- Recognize and explain the phenomenon of Simpson’s Paradox as it relates to interpreting the relationship between two variables.
- Recognize the distinction between association and causation, and identify potential lurking variables for explaining an observed relationship.
Unit 3: Producing Data
- Module 6: Sampling
- Critically evaluate the reliability and validity of results published in mainstream media.
- Identify the sampling method used in a study and discuss its implications and potential limitations.
- Summarize and describe the distribution of a categorical variable in context.
- Module 7: Designing Studies
- Determine how the features of a survey impact the collected data and the accuracy of the data.
- Explain how the study design impacts the types of conclusions that can be drawn.
- Identify the design of a study (controlled experiment vs. observational study) and other features of the study design (randomized, blind etc.).
Unit 4: Probability
- Module 8: Introduction (Probability)
- Explain how relative frequency can be used to estimate the probability of an event.
- Relate the probability of an event to the likelihood of this event occurring.
- Module 9: Finding Probability of Events
- Apply probability rules in order to find the likelihood of an event.
- Determine the sample space of a given random experiment.
- Find the probability of events in the case in which all outcomes are equally likely.
- When appropriate, use tools such as Venn diagrams or probability tables as aids for finding probabilities.
- Module 10: Conditional Probability and Independence
- Determine whether two events are independent or not.
- Explain the reasoning behind conditional probability, and how this reasoning is expressed by the definition of conditional probability.
- Find conditional probabilities and interpret them.
- Use probability trees as a tool for finding probabilities.
- Use the General Multiplication Rule to find the probability that two events occur (P(A and B)).
- Module 11: Random Variables
- Apply the rules of means and variances to find the mean and variance of a linear transformation of a random variable and the sum of two independent random variables.
- Distinguish between discrete and continuous random variables
- Explain how a density function is used to find probabilities involving continuous random variables.
- Find probabilities associated with the normal distribution.
- Find the mean and variance of a discrete random variable, and apply these concepts to solve real-world problems.
- Find the probability distribution of discrete random variables, and use it to find the probability of events of interest.
- Fit the binomial model when appropriate, and use it to perform simple calculations.
- Use the normal distribution as an approximation of the binomial distribution, when appropriate.
- Module 12: Sampling Distributions
- Apply the sampling distribution of the sample mean as summarized by the Central Limit Theorem (when appropriate). In particular, be able to identify unusual samples from a given population.
- Apply the sampling distribution of the sample proportion (when appropriate). In particular, be able to identify unusual samples from a given population.
- Explain the concepts of sampling variability and sampling distribution.
- Identify and distinguish between a parameter and a statistic.
Unit 5: Inference
- Module 14: Estimation
- Determine point estimates in simple cases, and make the connection between the sampling distribution of a statistic, and its properties as a point estimator.
- Explain what a confidence interval represents and determine how changes in sample size and confidence level affect the precision of the confidence interval.
- Find confidence intervals for the population mean and the population proportion (when certain conditions are met), and perform sample size calculations.
- Module 15: Hypothesis Testing
- Apply the concepts of: sample size, statistical significance vs. practical importance, and the relationship between hypothesis testing and confidence intervals.
- Carry out hypothesis testing for the population proportion and mean (when appropriate), and draw conclusions in context.
- Determine the likelihood of making type I and type II errors, and explain how to reduce them, in context.
- Explain the logic behind and the process of hypotheses testing. In particular, explain what the p-value is and how it is used to draw conclusions.
- In a given context, specify the and alternative hypotheses for the population proportion and mean.
- Module 16: Inference for Relationships
- Identify and distinguish among cases where use of calculations specific to independent samples, matched pairs, and ANOVA are appropriate.
- In a given context, carry out the inferential method for comparing groups and draw the appropriate conclusions.
- Specify the and alternative hypotheses for comparing groups.
- Module 17: Inference for Relationships Continued
- Choose the appropriate inferential method for examining the relationship between two variables and justify the choice.
- In a given context, carry out the appropriate inferential method for examining relationships and draw the appropriate conclusions.
- Specify the and alternative hypotheses for comparing relationships.
Course assessments, activities, and outline
UNIT 1: Introduction
Module 1: Introduction
Module 2: Learning Strategies
Module 3: The Big Picture
UNIT 2: Exploratory Data Analysis
Module 4: Examining Distributions
Module 5: Examining Relationships
UNIT 3: Producing Data
Module 6: Sampling
Module 7: Designing Studies
UNIT 4: Probability
Module 8: Introduction (Probability)
Module 9: Finding Probability of Events
Module 10: Conditional Probability and Independence
Module 11: Random Variables
Module 12: Sampling Distributions
UNIT 5: Inference
Module 13: Introduction (Inference)
Module 14: Estimation
Module 15: Hypothesis Testing
Module 16: Inference for Relationships
Module 17: Inference for Relationships Continued
System requirements
OLI system requirements, regardless of course:
- internet access
- an operating system that supports the latest browser update
- the latest browser update (Chrome recommended; Firefox, Safari supported; Edge and Internet Explorer are supported but not recommended)
- pop-ups enabled
- cookies enabled
Some courses include exercises with exceptions to these requirements, such as technology that cannot be used on mobile devices.
This course’s system requirements:
- none listed (subject to change)
Other course details
One semester.
December, 2017
Coming soon.

This work is licensed under a Creative Commons Attribution-NonCommercial-ShareAlike 4.0 International License.
Cost and payment options
$25 per student
Students are prompted for payment during the OLI course registration process, and can pay with a credit card or an OLI Payment Code purchased from your campus bookstore.
Bulk discounts and alternative payment arrangements are available, including institutional or departmental payments. Learn about discounts and payment options.
Included instructor tools
Instructors who teach with OLI courses benefit from a suite of free tools, technologies, and pedagogical approaches. Together they equip teachers with insights into real-time student learning states; they provide more effective instruction in less time; and they’ve been proven to boost student success.
If you’d like to update an OLI course for your students, or even develop a new course or program of study, contact OLI Support for information about the OLI Author platform.
Learning and participation data is displayed in the Learning Dashboard. Read more.

Learning Engineering is the virtuous cycle of iterative improvement of learning content, instructional technologies, and the greater scientific research community. Read more
OLI courses can be deployed with preferences in dozens of areas, including: