Introductory statistics course designed for students who may have a weak algebra background.
Concepts of Statistics
$20
- Description
- What students will learn
- Learning objectives by module
- Course assessments, activities, and outline
- Other course details
- System requirements
- Included instructor tools
Description
Overview:
The Concepts of Statistics course is an introductory statistics course designed for students who may have a weak algebra background. Authors followed language and literacy guidelines provided by experts who work with students who have limited literacy skills or English language learners. For example, course content is rigorous and college- level, the expository text is written in active voice with shorter sentences.
Learner Goals:
Build statistical reasoning and conceptual understanding of basic statistical concepts, while developing the students’ procedural (and technological) competence with basic statistical processes.
Please note:
Concepts in Statistics is only available for use in instructor-led classes of enrolled students, and carries a small per-student maintenance fee. It is not available to independent learners in Open & Free format.
Additional Course Details
Topics Covered:
Data Production, Graphical and Numerical Data Summaries for Quantitative Data, Examining Relationships in Quantitative Data, Examining Relationships in Categorical Data, Probability as It Relates to Statistical Inference, and Inference.
Estimated Time to Complete Course:
This course is designed to be equivalent to one semester of a college statistics course.
Additional Software or Materials Required:
To do the activities, you will need your own copy of Microsoft Excel, Minitab, the open source R software (free), TI calculator, or StatCrunch. Flash is required. More information is available in the course on the System Requirements page.
Maintenance Fee (per student):
$20 for academic students.
What students will learn
By the end of this course, students will have developed an understanding of basic statistical concepts and statistical reasoning, while developing their procedural (and technological) competence with basic statistical processes. They will learn to:
- develop strong learning strategies for Concepts in Statistics, as well as other online courses.
- determine the goal of a statistical study.
- understand the difference between types of variables .
- interpret data via graphical models.
- use simulation and probability to draw conclusions based on data.
Learning objectives by module
Unit 2: Types of Statistical Studies and Producing Data
- Module 4: Types of Statistical Studies
- Based on the study design, determine what types of conclusions are appropriate.
- Determine if a study is an experiment or an observational study.
- From a description of a statistical study, determine the goal of the study.
- From a research question, determine the goal of a statistical study.
- Module 5: Collecting Data—Sampling
- For an observational study, critique the sampling plan. Recognize implications and limitations of the plan.
- Module 6: Collecting Data—Conducting an Experiment
- Avoid overgeneralization of experiment results.
- Identify features of experiment design that control the effects of confounding.
Unit 3: Summarizing Data Graphically and Numerically
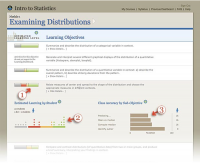
- Module 7: Distributions for Quantitative Data
- Describe the distribution of quantitative data using a dot plot.
- Describe the distribution of quantitative data using a histogram.
- Distinguish between quantitative and categorical variables in context.
- Module 8: Measures of Center
- Use mean and median to describe the center of a distribution.
- Module 9: Measures of Spread about the Median
- Use a five-number summary and a boxplot to describe a distribution.
- Module 10: Quantifying Variability Relative to the Mean
- Use mean and standard deviation to describe a distribution.
Unit 4: Examining Relationships: Quantitative Data
- Module 11: Scatterplots, Linear Relationships, and Correlation
- Distinguish between association and causation. Identify lurking variables that may explain an observed relationship.
- Use a correlation coefficient to describe the direction and strength of a linear relationship. Recognize its limitations as a measure of the relationship between two quantitative variables.
- Use a scatterplot to display the relationship between two quantitative variables. Describe the overall pattern (form, direction, and strength) and striking deviations from the pattern.
- Module 12: Fitting a Line
- For a linear relationship, use the least squares regression line to model the pattern in the data and to make predictions.
- Module 13: Assessing the Fit of a Line
- Use residuals, standard error, and r2 to assess the fit of a linear model.
Unit 5: Nonlinear Models
- Module 14: Exponential Relationships
- Use an exponential model (when appropriate) to describe the relationship between two quantitative variables. Interpret the model in context.
Unit 6: Relationships in Categorical Data with Intro to Probability
- Module 15: Two-Way Tables
- Analyze and compare risks using conditional probabilities.
- Analyze the distribution of a categorical variable.
- Analyze the relationship between two categorical variables using a two-way table.
- Calculate marginal, joint, and conditional percentages and interpret them as probability estimates.
- Create a hypothetical two-way table to answer more complex probability questions.
Unit 7: Probability and Probability Distributions
- Module 16: Probability and Distributions
- Distinguish between discrete random variables and continuous random variables.
- Interpret (in context) a probability as a long-run relative frequency of an event.
- Reason from probability distributions, using probability rules, to answer probability questions.
- Use conditional probability to identify independent events.
- Use probability distributions for discrete and continuous random variables to estimate probabilities and identify unusual events.
- Module 17: Continuous Random Variables
- Use a normal probability distribution to estimate probabilities and identify unusual events.
- Use a probability distribution for a continuous random variable to estimate probabilities and identify unusual events.
Unit 8: Linking Probability to Statistical Inference
- Module 18: Introduction to Inference
- Distinguish problems that call for estimating a parameter from problems that call for testing a hypothesis about a parameter.
- Distinguish situations that involve inference about a population mean from those that involve a population proportion.
- Use simulation and probability to draw conclusions based on data.
- Module 19: Distribution of Sample Proportions
- Describe the sampling distribution for sample proportions and use it to identify unusual (and more common) sample results.
- Distinguish between a sample statistic and a population parameter.
- Use a z-score and the standard normal model to estimate probabilities of specified events.
- Module 20: Introduction to Statistical Inference
- Find a confidence interval to estimate a population proportion when conditions are met. Interpret the confidence interval in context.
- Interpret the confidence level associated with a confidence interval.
- Test a hypothesis about a population proportion using a simulated sampling distribution or a normal model of the sampling distribution. State a conclusion in context.
Unit 9: Inference for One Proportion
- Module 21: Estimating a Population Proportion
- Construct a confidence interval to estimate a population proportion when conditions are met. Interpret the confidence interval in context.
- For a confidence interval, interpret the meaning of a confidence level and relate it to the margin of error.
- Recognize situations that call for testing a claim about a population proportion or estimating a population proportion.
- Module 22: Hypothesis Testing
- Given a claim about a population, determine and alternative hypotheses.
- Recognize the logic behind a hypothesis test and how it relates to the P-value.
- Recognize type I and type II errors.
- When testing a claim, distinguish among situations involving one population mean, one population proportion, two population means, or two population proportions.
- Module 23: Hypothesis Test for a Population Proportion
- Conduct a hypothesis test for a population proportion. State a conclusion in context.
- Distinguish statistical significance from practical importance.
- From a description of a study, evaluate whether the conclusion of a hypothesis test is reasonable.
- Interpret the P-value as a conditional probability in the context of a hypothesis test about a population proportion.
- Recognize when a situation calls for testing a hypothesis about a population proportion.
Unit 10: Inference for Two Proportions
- Module 24: Distribution of Differences in Sample Proportions
- Describe the sampling distribution of the difference between two proportions.
- Determine if a study involving two proportions is an experiment or an observational study.
- Draw conclusions about a difference in population proportions from a simulation.
- Estimate the probability of an event using a normal model of the sampling distribution.
- Recognize when to use a hypothesis test or a confidence interval to compare two population proportions or to investigate a treatment effect for a categorical variable.
- Module 25: Estimate the Difference between Population Proportions
- Construct a confidence interval to estimate the difference between two population proportions (or the size of a treatment effect) when conditions are met. Interpret the confidence interval in context.
- Given the description of a statistical study, evaluate whether conclusions are reasonable.
- Interpret the meaning of a confidence level associated with a confidence interval and describe how the confidence level affects the margin of error.
- Recognize when to use a hypothesis test or a confidence interval to compare two population proportions or to investigate a treatment effect for a categorical variable.
- Module 26: Hypothesis Test for a Difference in Population Proportions
- Given the description of a statistical study, evaluate whether conclusions are reasonable.
- Identify type I and type II errors and select an appropriate significance level based on an analysis of the consequences of each type of error.
- Interpret the P-value as a conditional probability.
- Recognize when to use a hypothesis test or a confidence interval to compare two population proportions or to investigate a treatment effect for a categorical variable.
- Under appropriate conditions, conduct a hypothesis test for comparing two population proportions or two treatments. State a conclusion in context.
Unit 11: Inference for Means
- Module 27: Distribution of Sample Means
- Describe the sampling distribution of sample means.
- Draw conclusions about a population mean from a simulation.
- Estimate the probability of an event using a normal model of the sampling distribution.
- Recognize when to use a hypothesis test or a confidence interval to draw a conclusion about a population mean.
- Module 28: Estimating a Population Mean
- Adjust the margin of error by making changes to the confidence level or sample size.
- Construct a confidence interval to estimate a population mean when conditions are met. Interpret the confidence interval in context.
- Interpret the meaning of a confidence level associated with a confidence interval.
- Module 29: Hypothesis Test for a Population Mean
- Interpret the P-value as a conditional probability.
- Recognize when to use a hypothesis test or a confidence interval to draw a conclusion about a population mean.
- Under appropriate conditions, conduct a hypothesis test about a mean for a matched pairs design. State a conclusion in context.
- Under appropriate conditions, conduct a hypothesis test about a population mean. State a conclusion in context.
- Module 30: Inference for a Difference between Population Means
- Construct a confidence interval to estimate a difference in two population means (when conditions are met). Interpret the confidence interval in context.
- Under appropriate conditions, conduct a hypothesis test about a difference between two population means. State a conclusion in context.
Unit 12: Chi-Square Tests
- Module 31: Chi-Square Test for One-Way Tables
- Conduct a chi-square goodness-of-fit test. Interpret the conclusion in context.
- Module 32: Chi-Square Tests for Two-Way Tables
- Conduct a chi-square test of homogeneity. Interpret the conclusion in context.
- Conduct a chi-square test of independence. Interpret the conclusion in context.
Course assessments, activities, and outline
UNIT 1: Introduction to Concepts in Statistics Course
Module 1: Introduction to Concepts in Statistics Course
Module 2: Learning Strategies
Module 3: The Big Picture
UNIT 2: Types of Statistical Studies and Producing Data
Module 4: Types of Statistical Studies
Checkpoint: “Types of Statistical Studies”
Module 5: Collecting Data—Sampling
Checkpoint: “Collecting Data—Sampling”
Module 6: Collecting Data—Conducting an Experiment
Checkpoint: “Collecting Data—Conducting an Experiment”
Checkpoint: Types of Statistical Studies and Producing Data
UNIT 3: Summarizing Data Graphically and Numerically
Module 7: Distributions for Quantitative Data
Checkpoint: “Distributions for Quantitative Data”
Module 8: Measures of Center
Checkpoint: “Measures of Center”
Module 9: Measures of Spread about the Median
Checkpoint: “Quantifying Variability Relative to the Median”
Module 10: Quantifying Variability Relative to the Median
Checkpoint: “Quantifying Variability Relative to the Median”
Checkpoint: Summarizing Data Graphically and Numerically
UNIT 4: Examining Relationships: Quantitative Data
Module 11: Scatterplots, Linear Relationships, and Correlation
Checkpoint: “Scatterplots, Linear Relationships, and Correlation”
Module 12: Fitting a Line
Checkpoint: “Fitting a Line”
Module 13: Assessing the Fit of a Line
Checkpoint: “Assessing the Fit of a Line”
Checkpoint: Examining Relationships: Quantitative Data
UNIT 5: Nonlinear Models
Module 14: Exponential Relationships
Checkpoint: Nonlinear Models
UNIT 6: Relationships in Categorical Data with Intro to Probability
Module 15: Two-Way Tables
Checkpoint: Relationships in Categorical Data with Intro to Probability
UNIT 7: Probability and Probability Distributions
Module 16: Probability and Distributions
Checkpoint: “Probability and Distributions”
Module 17: Continuous Random Variables
Checkpoint: “Continuous Random Variables”
Checkpoint: Probability and Probability Distribution
UNIT 8: Linking Probability to Statistical Inference
Module 18: Introduction to Inference
Module 19: Distribution of Sample Proportions
Checkpoint: “Distribution of Sample Proportions”
Module 20: Introduction to Statistical Inference
Checkpoint: “Introduction to Statistical Inference”
Checkpoint: Linking Probability to Statistical Inference
UNIT 9: Inference for One Proportion
Module 21: Estimating a Population Proportion
Checkpoint: “Estimating a Population Proportion”
Module 22: Hypothesis Testing
Checkpoint: “Hypothesis Testing”
Module 23: Hypothesis Test for a Population Proportion
Checkpoint: “Hypothesis Test for a Population Proportion”
Checkpoint: Inference for One Proportion
UNIT 10: Inference for Two Proportions
Module 24: Distribution of Differences in Sample Proportions
Checkpoint: Distribution of Differences in Sample Proportions
Module 25: Estimate the Difference between Population Proportions
Checkpoint: Estimate the Difference between Population Proportions
Module 26: Hypothesis Test for a Difference in Population Proportions
Checkpoint: Hypothesis Test for a Difference in Population Proportions
Checkpoint: Inference for Two Proportions
UNIT 11: Inference for Means
Module 27: Distribution of Sample Means
Checkpoint: “Distribution of Sample Means”
Module 28: Estimating a Population Mean
Checkpoint: “Estimating a Population Mean”
Module 29: Hypothesis Test for a Population Mean
Checkpoint: “Hypothesis Test for a Population Mean”
Module 30: Inference for a Difference between Population Means
Checkpoint: “Inference for a Difference between Population Means”
Checkpoint: Inference for Means
UNIT 12: Chi-Square Tests
Module 31: Chi-Square Test for One-Way Tables
Checkpoint: “Chi-Square Tests for One-Way Tables”
Module 32: Chi-Square Tests for Two-Way Tables
Checkpoint: “Chi-Square Tests for Two-Way Tables”
Checkpoint: Chi-Square Tests
Other course details
One semester.
January 2018
Coming soon.

This work is licensed under a Creative Commons Attribution-NonCommercial-ShareAlike 4.0 International License.
System requirements
OLI system requirements, regardless of course:
- internet access
- an operating system that supports the latest browser update
- the latest browser update (Chrome recommended; Firefox, Safari supported; Edge and Internet Explorer are supported but not recommended)
- pop-ups enabled
- cookies enabled
Some courses include exercises with exceptions to these requirements, such as technology that cannot be used on mobile devices.
This course’s system requirements:
- none listed (subject to change)
Cost and payment options
$25 per student
Students are prompted for payment during the OLI course registration process, and can pay with a credit card or an OLI Payment Code purchased from your campus bookstore.
Bulk discounts and alternative payment arrangements are available, including institutional or departmental payments. Learn about discounts and payment options.
Included instructor tools
Instructors who teach with OLI courses benefit from a suite of free tools, technologies, and pedagogical approaches. Together they equip teachers with insights into real-time student learning states; they provide more effective instruction in less time; and they’ve been proven to boost student success.
If you’d like to update an OLI course for your students, or even develop a new course or program of study, contact OLI Support for information about the OLI Author platform.
Learning and participation data is displayed in the Learning Dashboard. Read more.

Learning Engineering is the virtuous cycle of iterative improvement of learning content, instructional technologies, and the greater scientific research community. Read more
OLI courses can be deployed with preferences in dozens of areas, including: